Infographic is the new cool thing on the internet and everyone seems to love it – teachers, project managers and even online entrepreneurs. I used to think that you need a professional designer to create one, but as it turns out, you can actually learn how to create your own infographic for free. Piktochart has all the tools and here’s how you can get started.
What Is Piktochart?
Launched in 2012, Piktochart is the brainchild of Ai Ching and Andrea who are both passionate about sharing information through the power of visual. This cool app provides you a complete set of tools to create and publish professional-looking infographic right from the scratch. The creative company has won numerous awards for innovative entrepreneurship and currently serves more than 4 million users worldwide.
How to Create Your Own Infographic for Free?
This process can be divided into 4 simple steps.
(1) Pick a Format
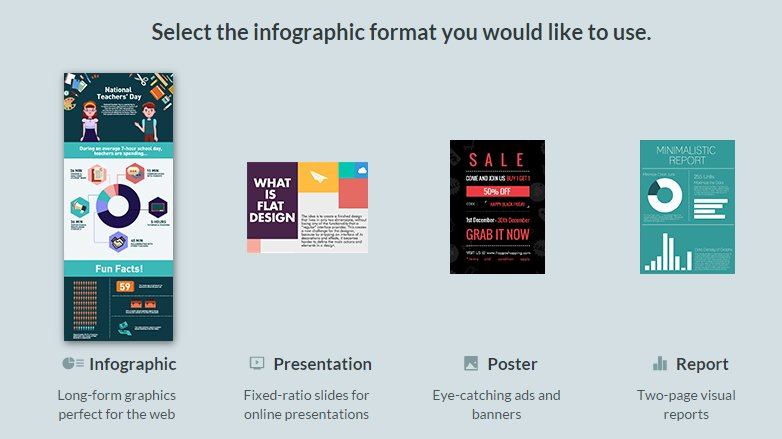
There are the four types of formats available at Piktochart.
- Standard Infographics – Also known as long form infographics, this format collects information from various sources that can be embedded on websites or emailed.
- Presentation Infographics – Similar to a PowerPoint presentation, this format allows you to construct infographics in a series of ‘blocks’ that can later be converted into multimedia slides.
- Poster Infographics – Suitable for ads and banners, this is a single page format for conveying attention-grabbing shout out.
- Report Infographics – Document-like format used to display results from an event, experiment or time period.
(2) Pick a Template

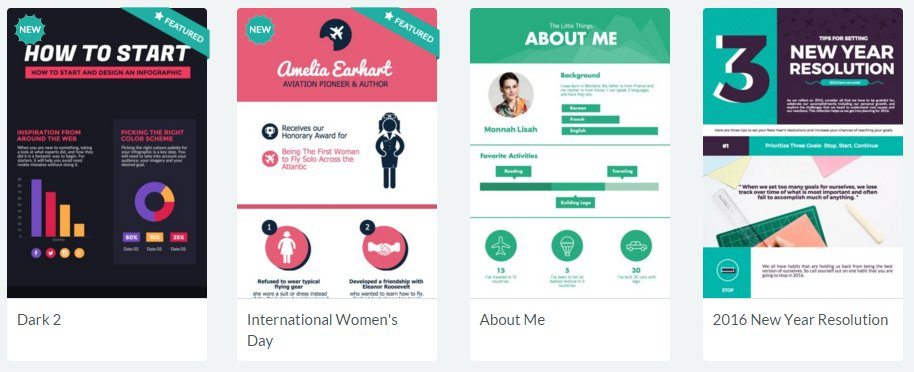
For each format, you can choose to start with the free or paid templates. You can also search according to the theme, preview the sample before deciding to create on it.
(3) Start Designing

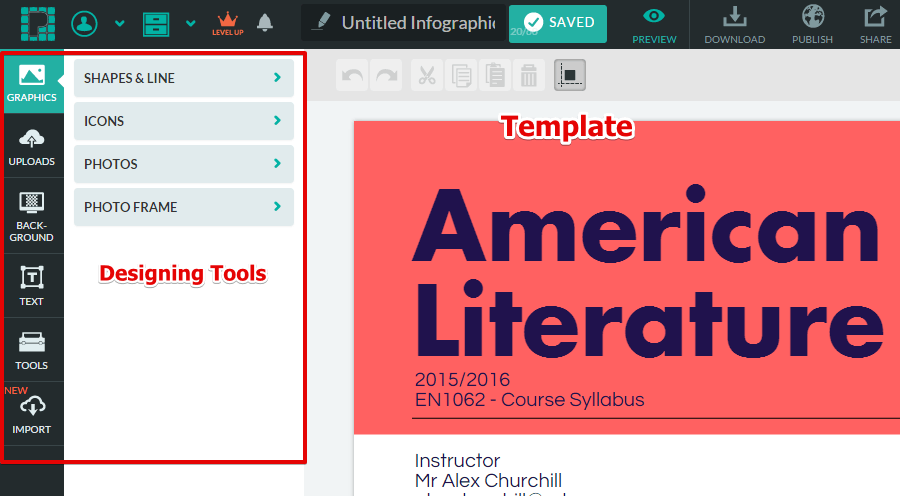
After you select a template, you can start to design the infographic on the drag-and-drop editing platform. All the functions are intuitive, so even if you have never done any designing work before, it’s quite easy to understand the flow. Here are some of the features that you can edit;
- Add graphics according to shapes, icons and photos.
- Upload your own images.
- Change the background color or image.
- Customize your own text or use a text frame.
- Add charts, maps or videos in the infographic.
(4) Share Your Work
Next, it’s time to share your work online. There are a few ways to do this;
- Download it as an image or PDF format.
- Share the link to social networks.
- Publish it on your blog by embedding the HTML on your website.

For your better understanding, here’s a quick video to show you how easy it is to use Piktochart.
How Much Does It Cost?
Depending on what kind of niche you are involved in, Piktochart offers a few pricing plans.
- Lite $15/month and Pro $29/month for individuals or companies.
- Pro $39.99 (for 12 months) for non-profit organizations.
- Individual Pro $39.99 (for 12 months) and Classroom Pro $120 (for 4 months) for educators and schools.
Of course, if you are a start-up on a shoestring budget or simply want to design some infographic just for fun, you can sign up for the free account (with limited features) and stay as a member for as long as you wish.
Let’s Hear What Other People Say about Piktochart…
For many people, Piktochart is relatively a dynamic tool for visual creation as compared to their competitors.

With the new HTML feature, infographics that are created from Piktochart come with SEO features so your work can become more visible online.

Now, take a look at how Piktochart becomes a valuable tool for teaching high school students.
Is Piktochart Worthy of Your Time?
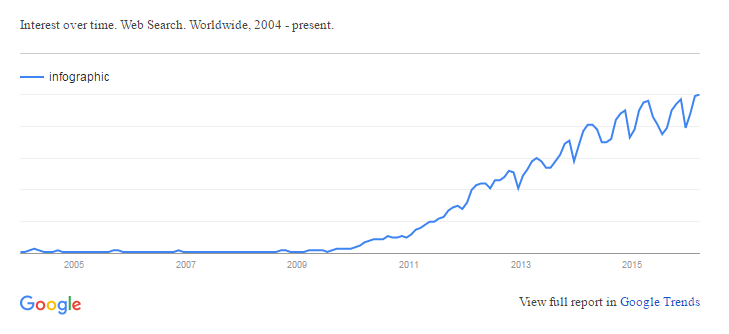
Still not sure if a bunch of visual text is popular online? Well, let me show you an interesting trend which I discovered recently.

Since 2011, the term ‘infographic’ has been widely searched and by looking at the stats, there is no sign of it slowing down anytime soon. This could mean a lot of things;
- More people are using infographics to share things online.
- More companies and organizations are using infographics to deliver their product and service information to consumers.
- More educators are using it to simplify and to make classes more interesting.
- Infographic is fast becoming a popular marketing tool for online marketers and small business owners.
So if you asked me, learning how to create your own infographic is certainly a skill worth knowing and Piktochart is the best place to start.
Do you have an idea that can be transformed into an infographic? Create a free WordPress blog with SiteRubix and spread your creativity online.
Do you have any thoughts or questions about this topic? Feel free to leave them in the comment area below and I’ll get back to you.


Great update on some of the latest trends on doing infographics created with Piktochart. I was not aware of this program and can see why so many people would use it. It makes fast and easy work of creating information in a graphic manner. Other methods would take a lot longer to create with other general usage software.
Definitely Travis,
As an online business owner, you want to spend more time creating content for your website and not spend so much on the graphic aspect. The Piktochart software can certainly speed things up. I am sure you’ll find something useful out of it for your renovation site.
Hi Cathy,
Piktochart really does look awesome. I am currently in the middle of creating my own website at the moment and was thinking how I could possibly create something like this. Piktochart is perfect. I’m not extremely tech savy but this does look very easy to use. Thank you so much you’ve just saved me a lot of time researching similar program. Thanks.
Hi there Julian,
The Piktochart platform is very intuitive and you don’t need to be a very technical person to learn how to use it. Adding infographics to your content will certainly make it more enjoyable to read. You can use the free plan to find out more.
Hi Cathy. It has been so long since I’ve hit your blog.
Actually, I’m even starting to look a little more on how I can improve my pictures on my own side. I am as I said not have started infographics yet.
But it is a good complement to the text. I can see that there is a free version. Can I ask how limited is it really? Am I allowed to test the tool for a certain period or is it just a stripped down version of it?
Welcome back to my blog Steen,
You can use Piktochart’s free plan for as long as you like. It’s not exactly a stripped down version – you just get limited access to the templates. Otherwise, you can use the editor to create your own infographic from scratch, for as many as you like.
Hope this helps.
Hi Cathy,
Thanks for your sharing of Infographic. It sounds like a very nice tool for making my web site look more interesting and attractive. I’ve always been bothered by the thought what kind of pictures I should add to make my site not that boring. I saw other people’s nice graphic, but just don’t have any idea to do. Now I’ll get it a try.
Hi there Louis,
Adding some graphics to your blog can make them more engaging to read. You can actually use infographics that are available online; just remember to give credit to the source. Also for images, you can visit Photopin.com – they have a million of varieties. Just add the attribution at the end of your blog and your are good to go 🙂
This looks like a great piece of software. I am definitely going to go check it out. It could be used for lots of different things. I like that fact that you posted a how to video on it. It’s always nice to see how things work in case someone gets stuck
I really enjoy infographics when it comes to something that I want to know a lot about in a small amount of time. It looks like Piktochart has really made creating infographics easy and your review was also very helpful! I have been looking to include infographics in my website so I will definitely check them out. Are you still able to create full inforgraphics with the free account?
Hey there Nate,
Yes with the free account, you can still create a full infographic using the graphics in their image library. It comes with a watermark though. I like to include infographic in my blog as well because I think they make a good summary for very elaborative topics and improves the user experience.